
领先一步
VMware 提供培训和认证,助您加速进步。
了解更多Spring 的各位!在这个简短的系列中,我们将介绍 Spring Cloud 对 Google Cloud Platform 的集成,称为 Spring Cloud GCP。 Spring Cloud GCP 是 Google 和 Pivotal 联合努力的成果,旨在为使用 Google Cloud Platform 的 Spring Cloud 开发者提供一流的体验。Pivotal Cloud Foundry 用户将享有与 GCP 服务代理更轻松的集成。这些内容由 Google Cloud 开发者倡导者,也是我的朋友 Ray Tsang 协助撰写。您也可以在我们的 Google Next 2018 会议 Bootiful Google Cloud Platform 中观看 Spring Cloud GCP 的演练。谢谢,朋友!
该系列共有八篇文章。以下是全部内容:
随着我们将越来越多的应用程序迁移到云端,并引入越来越多的微服务,理解发生了什么问题——以及在哪里??——的复杂性也随之增加。分布式跟踪解决了这个问题。理论上,分布式跟踪是一项简单的任务。对于进入或离开系统的每个请求… 对于系统中的每个入口或出口,附加一个 UUID,如果它尚不存在,则将其传播。不幸的是,当请求在同步和异步地从一个节点移动到另一个节点,跨越线程和网络边界时,这种逻辑是繁琐且难以实现的。Spring Cloud Sleuth 解决了这个问题,并提供了一个 SPI,后端分布式跟踪系统,如 OpenZipkin 和 Google Cloud Stack Driver,可以插入其中。
与所有 GCP API 一样,我们必须首先启用此 API。
gcloud services enable cloudtrace.googleapis.com
我们将设置一个简单的 REST API 和一个简单的 REST 客户端,并使用 Spring Cloud GCP Stack Driver 支持来快速跟踪这些交互。
让我们先看看我们简单的 REST API。启动一个新项目(使用上面骨架的 pom.xml),并添加 org.springframework.boot : spring-boot-starter-web 和 org.springframework.cloud : spring-cloud-gcp-starter-trace。我们的 REST API(嗯,至少是端点)将在调用 https://:8080/greeting/{id}} 时返回 "greetings, a name here!"。这是服务代码,首先
package com.example.gcp.trace;

import org.springframework.boot.SpringApplication;
import org.springframework.boot.autoconfigure.SpringBootApplication;
import org.springframework.web.bind.annotation.GetMapping;
import org.springframework.web.bind.annotation.PathVariable;
import org.springframework.web.bind.annotation.RestController;

@RestController
@SpringBootApplication
public class TraceServiceApplication {

        @GetMapping("/greeting/{id}")
        String greet(@PathVariable String id) {
                return "greetings, " + id + "!";
        }

        public static void main(String args[]) {
                SpringApplication.run(TraceServiceApplication.class, args);
        }
}
配置可能更有趣。
src/main/resources/application.properties。
spring.cloud.gcp.trace.enabled=true


spring.sleuth.sampler.probability=1
spring.sleuth.web.skipPattern=(^cleanup.*|.+favicon.*)


server.port=8081


spring.application.name=trace-service
spring.application.name 是我们应用程序的逻辑名称,可用于在跟踪树、服务注册表等中区分其他应用程序。客户端在应用程序启动时发出一百个 HTTP 请求。它使用的 RestTemplate 已由 Spring Cloud Sleuth 自动配置进行了后处理,以拦截和跟踪所有 HTTP 调用。
package com.example.gcp.trace;

import lombok.extern.slf4j.Slf4j;
import org.springframework.boot.SpringApplication;
import org.springframework.boot.autoconfigure.SpringBootApplication;
import org.springframework.boot.context.event.ApplicationReadyEvent;
import org.springframework.cloud.sleuth.annotation.NewSpan;
import org.springframework.context.annotation.Bean;
import org.springframework.context.event.EventListener;
import org.springframework.stereotype.Component;
import org.springframework.web.client.RestTemplate;

import java.util.stream.IntStream;

@Slf4j
@SpringBootApplication
public class TraceClientApplication {

        @Component
        public static class Client {

                private final RestTemplate restTemplate;

                public Client(RestTemplate restTemplate) {
                        this.restTemplate = restTemplate;
                }

                @EventListener(ApplicationReadyEvent.class)
                @NewSpan("client")
                public void before() {
                        IntStream
                            .range(0, 100)
                            .mapToObj(i ->
                                restTemplate
                                    .getForEntity("https://:8081/greeting/{id}", String.class, i)
                                    .getBody())
                            .forEach(response -> log.info("result: " + response));
                }
        }

        @Bean
        RestTemplate restTemplate() {
                return new RestTemplate();
        }

        public static void main(String args[]) {
                SpringApplication.run(TraceClientApplication.class, args);
        }
}
RestTemplate 的直接用法,用于连接到我们的服务。如果我们想在没有共享父跨度的情况下发送 100 个请求,我们就不需要 @NewSpan。如果外部有 100 个请求进来,并且击中了客户端的一个 HTTP 端点,并且该端点随后导致 100 个请求发送到服务,那么我们将拥有一个共享的总体跨度。一个带有多个跨度的单一跟踪。这个节点的配置与服务的配置几乎相同。
spring.cloud.gcp.trace.enabled=true

spring.sleuth.sampler.probability=1
spring.sleuth.web.skipPattern=(^cleanup.*|.+favicon.*)

spring.application.name=trace-client

server.port=8080
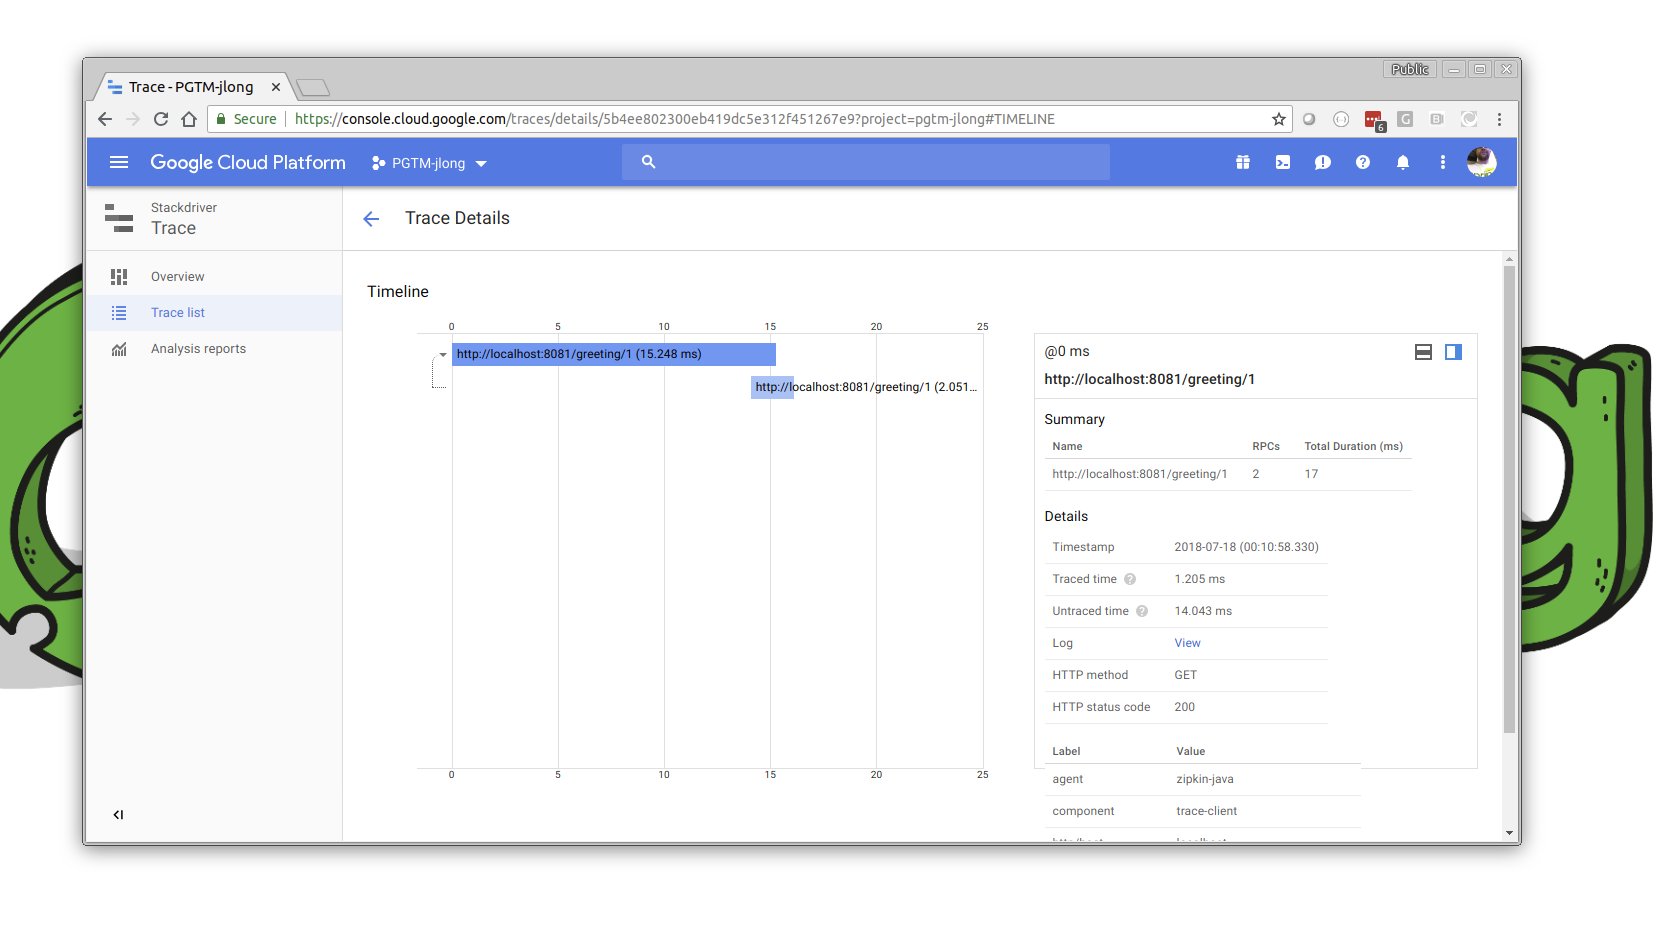
为了看到这一切的运行效果,您需要先启动服务,然后启动客户端,然后前往 Google Cloud Console。点击屏幕左侧的“汉堡包”菜单,然后点击 STACKDRIVER → TRACE。在那里,您将能够检查刚刚通过您的服务流过的请求。
Stackdriver 是包括监控、跟踪以及——这非常酷!——实时调试运行应用程序在内的一系列服务的总称。您当然可以花更多的时间——您应该!——在这个控制台的这一部分。足够说的是,Google理解可观测性,这反映在他们的服务中。